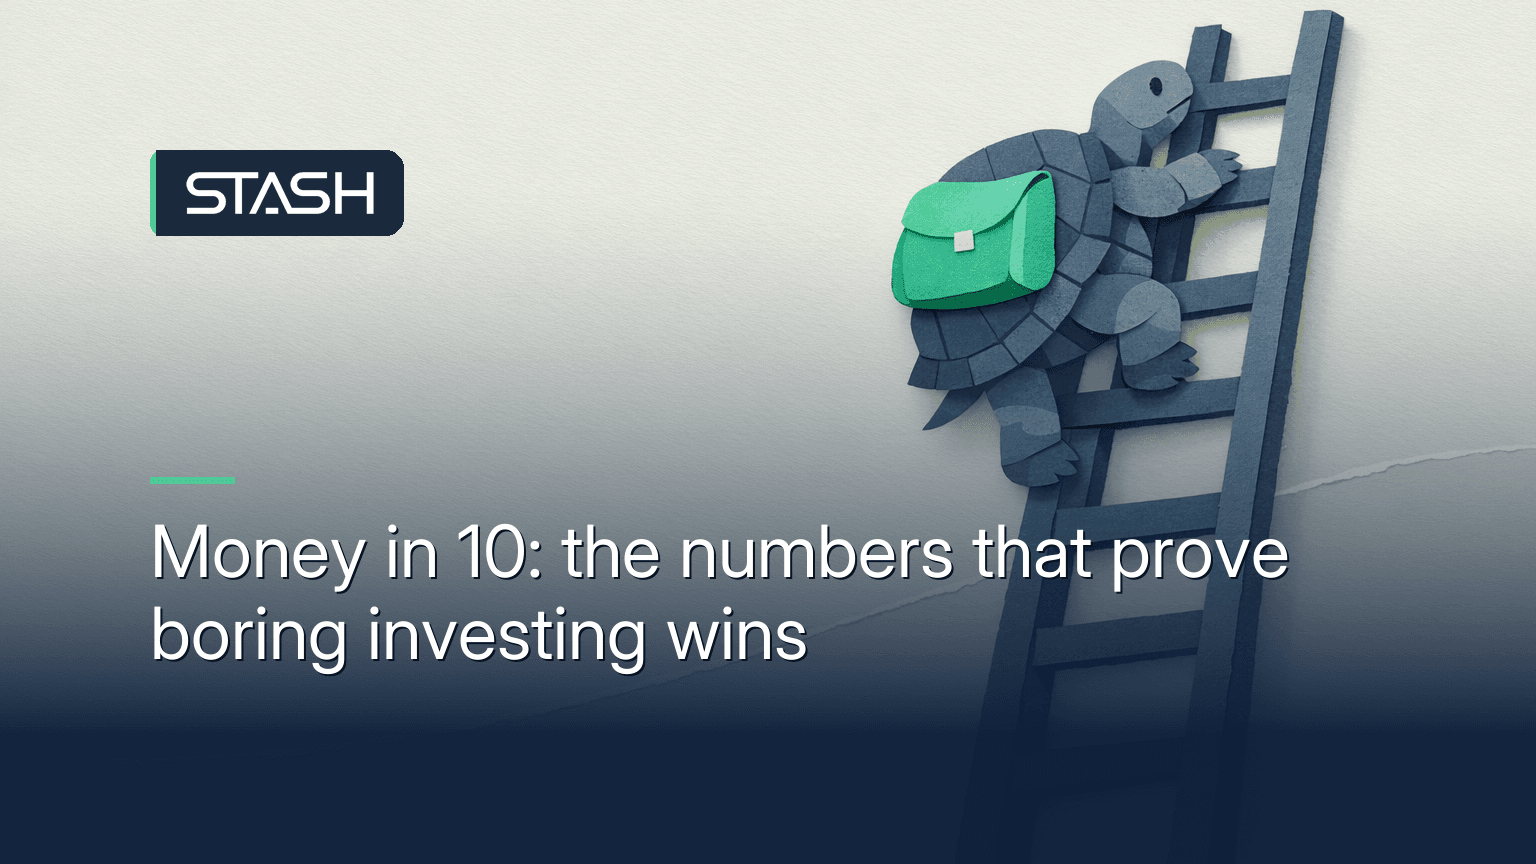
Money in 10: the numbers that prove boring investing wins
Published: Jun 26, 2026
• Updated: Jul 04, 2026
In this article:
- 1. Miss 10 days, lose half
- 2. The trap hiding inside number one
- 3. Waiting 10 years can cost you $280,000
- 4. The 10-second math trick
- 5. $5 a day becomes $185,000
- 6. Cash quietly loses
- 7. The odds are quietly on your side
- 8. The 20-year streak nobody talks about
- 9. The boring engine behind the returns
- 10. The number that explains all the others
- Bottom line
- Sources
- Important disclosures
- Frequently asked questions
The most expensive mistake in investing is trying to be clever. Miss the stock market's 10 best days over the last 20 years and you would have given up more than half your gains, according to JPMorgan Asset Management research, and most of those best days landed right next to the worst ones. Here are 10 numbers that prove the boring, steady way keeps beating the exciting way.
Send this to anyone who has ever panic-sold, or bragged about timing the market.
1. Miss 10 days, lose half
Out of roughly 5,000 trading days in 20 years, missing just the 10 best ones cuts your return by more than half. The market rewards showing up, not guessing right.
2. The trap hiding inside number one
Most of the market's best days happen within two weeks of its worst days, according to J.P. Morgan Asset Management. So the people who panic-sell in a crash usually miss the rebound that follows. Doing nothing is a strategy.
Send this to the friend who sold everything in the last dip.
3. Waiting 10 years can cost you $280,000
Invest $200 a month starting at 25 and you could have about $525,000 by 65. Start the exact same plan at 35 and it is about $244,000. Ten years of waiting, more than a quarter million dollars. See The Real Cost of Waiting to Invest.
This is a hypothetical illustration of how an investment could grow over time. It assumes monthly contributions of $200, a 7% average annual return compounded monthly, and time horizons of 30 and 40 years, with no taxes, fees, or subscription costs. Actual results will vary due to market conditions, volatility, taxes, fees, and subscription costs. This projection is for informational purposes only and is not the actual performance of any client or Stash portfolio. All investments involve risk, including possible loss of principal.
4. The 10-second math trick
Want to know how fast your money doubles? Divide 72 by your return. At 7% a year, money doubles about every decade, with zero extra effort from you. That is compounding doing the work, see How Compound Interest Works (and Why It Matters).
5. $5 a day becomes $185,000
Skip nothing, just redirect five dollars a day into investing. Over 30 years at a 7% average return, that is roughly $185,000. The amount feels small. The result does not.
This is a hypothetical illustration of how an investment could grow over time. It assumes about $5 a day (roughly $150 a month), a 7% average annual return compounded monthly, and a 30-year time horizon, with no taxes, fees, or subscription costs. Actual results will vary due to market conditions, volatility, taxes, fees, and subscription costs. This projection is for informational purposes only and is not the actual performance of any client or Stash portfolio. All investments involve risk, including possible loss of principal.
6. Cash quietly loses
A dollar from 20 years ago buys about 60 cents of goods today, according to U.S. Bureau of Labor Statistics inflation data. "Safe" money sitting in cash slowly melts. Investing is how you keep up with the cost of living, not just beat it.
7. The odds are quietly on your side
Since 1928, the US stock market has finished up in about 3 out of every 4 years. The headlines scream about the down years. The math quietly favors the patient.
8. The 20-year streak nobody talks about
Pick any 20-year stretch in modern US market history and a diversified investor who stayed in came out ahead. Not most stretches. Every one. Time turns volatility into a footnote.
9. The boring engine behind the returns
Since 1960, about 84% of the S&P 500's total return has come from reinvested dividends and the compounding they unlock, according to Hartford Funds. Not stock-picking. Just reinvesting the payouts and waiting.
10. The number that explains all the others
Over the last decade, the average fund investor earned about 1.1 percentage points less per year than the very funds they owned, giving up roughly 15% of their potential returns, according to Morningstar. The gap is not the market. It is us, buying high when it feels exciting and selling low when it feels scary. Boring investing wins because it removes the one variable that keeps losing: our own timing.
Send this to someone who is doing the right thing already. Then keep going.
Frequently asked questions
Guess: how much does missing the market's 10 best days cost you?
More than half your gains over 20 years. And because the best days cluster next to the worst, trying to dodge the bad days is how most people miss the good ones.
Guess: what does $5 a day become in 30 years?
Around $185,000, in this hypothetical example at a 7% average annual return. Small, automatic, and boring beats large, occasional, and dramatic.
This is a hypothetical illustration of how an investment could grow over time. It assumes about $5 a day (roughly $150 a month), a 7% average annual return compounded monthly, and a 30-year time horizon, with no taxes, fees, or subscription costs. Actual results will vary due to market conditions, volatility, taxes, fees, and subscription costs. This projection is for informational purposes only and is not the actual performance of any client or Stash portfolio. All investments involve risk, including possible loss of principal.
Is it too late to start investing?
No. The best edge in investing is time, not timing, and the second best is starting now instead of later. See The Stash Way: Invest Regularly.
Are these numbers investment advice?
No. Every number here is educational context and several are hypothetical illustrations, not a recommendation to buy or sell anything. What is right for you depends on your own situation. A few common myths are worth unlearning too: see Investing Myths That Hold People Back.
Bottom line
Exciting investing makes a better story. Boring investing makes more money. Show up, spread it out, leave it alone, and let time do the heavy lifting.
Sources
Items 1 and 2 (missing the best days, and the best days clustering near the worst): J.P. Morgan Asset Management, Guide to the Markets, based on the S&P 500 over the 20 years ending December 2022.
Items 3 and 5 (the cost of waiting, and $5 a day): hypothetical illustrations by Stash, assuming a 7% average annual return compounded monthly. Illustrations only, not predictions.
Item 4 (the Rule of 72): a standard mathematical approximation.
Item 6 (cash and inflation): U.S. Bureau of Labor Statistics, Consumer Price Index.
Items 7 and 8 (positive years and the 20-year record): S&P 500 historical calendar-year and rolling 20-year total returns since 1928 (NYU Stern dataset).
Item 9 (dividends and compounding): Hartford Funds, "The Power of Dividends: Past, Present, and Future," based on the S&P 500 since 1960.
Item 10 (the investor return gap): Morningstar, "Mind the Gap" 2024.
Important disclosures
This article is for educational purposes only and is not a recommendation to buy, sell, or hold any security. Hypothetical examples are for illustration only, assume a fixed average annual return that real markets do not deliver, and do not reflect fees or taxes. Investing involves risk, including the possible loss of principal. Past performance is not a guarantee of future results. Stash is a registered investment adviser; what is right for you depends on your specific situation.
Educational only and does not constitute investment, legal, accounting, or tax advice. See full disclosures at www.stash.com/disclosures.

Written by
Team Stash
We want to turn money into a source of hope and opportunity. We teach people how to build good habits, save more and make it easy and affordable to get started investing. So far, we’ve helped over 6 million people create a more secure financial future with our expert advice and award winning investing app.
Related articles
guides
Jun 26, 2026
Money in 10: the numbers that prove boring investing wins
guides
Jun 15, 2026
Why Impatient Traders Got Wrecked by Market Swings

robo-advisor
Mar 19, 2026
FAQ: Stockpile
guides
Jan 23, 2026
Closing an IRA? State Withholding Requirements
guides
Jan 16, 2026
Age of majority
investing
Jan 13, 2026
FAQ: Personal Portfolio

By using this website you agree to our Terms of Use and Privacy Policy. To begin investing on Stash, you must be approved from an account verification perspective and open a brokerage account.