Oct 19, 2018
How Do You Read a Stock Ticker?
What do those all those numbers and letters mean? We explain.
You’ve probably even seen a series of letters and numbers scrolling across the bottom of your favorite news program on TV.
But what do those numbers and letters mean?
Here’s a quick breakdown of how to read a stock ticker.
There are 5 basic components to reading stock charts
The combination of letters, numbers, and arrows can give you a surprising amount of information about a particular investment.
Ticker Symbol
Volume
Price Traded (Trade Value)
Change Direction
Change Amount
1. Ticker Symbol
This is the series of letters that represent a company being traded on an exchange.
The number of letters can range from one to five, and the number of letters can tell you things like the exchange on which the security trades.
For the New York Stock Exchange, this is limited to three letters or less. For example:
X represents United States Steel
F represents Ford Motor Co
GE represents General Electric.
On the NASDAQ a company can use four or five letters in its ticker symbol.
For example:
CSCQ represents Cisco System
TSLA represents Tesla
NFLX represents Netflix
Stock tickers: Foreign companies
Foreign companies that trade on a either the NYSE or the NASDAQ may contain an extra letter—either an F or Y—to denote a non-U.S. company. For example:
RYAAY is the ticker that budget airline Ryanair uses on the Nasdaq.
Who chooses the ticker symbol?
A company gets to choose what letters they would like, with some exceptions. For obvious reasons, the letters can’t already be in use by another company, and companies also can’t use symbols that might cause confusion—for example using FBI, the abbreviation for the federal law enforcement agency.
Some companies like to have some fun with their ticker symbols.
Literally. FUN represents the amusement park company Cedar Fair. Southwest Airlines chose LUV as its ticker, for the Love Field location where the company originated in Dallas, Texas.
2. Volume
Next, you have the volume for the trade being quoted. This is how many shares of this stock are being traded on a given day. Since securities (stocks, bonds, and funds) are traded in really large quantities, the volume is listed in thousands (K) or millions (M).
Most investors won’t pay attention to trading volume. But an unusually high buying or selling volume can indicate that something important is happening with a stock. Similarly, a drop off in trading volume can indicate that investors could be losing interest in a stock.
3. Price Traded (Trade Value)
This is the price per share. This number represents the price at which the stock was last bought and sold. This could also be expressed as the ‘trade value,’ or the value of the share during the previous trade.
Check out: You’ve Got Shares! But What is a Share Anyway?
This also helps aid in the transparency of a particular market. If you know the value that a stock is trading, you can be sure that if you want to buy it, you are paying the same price as everyone else.
4. Change Direction
An arrow pointing up or down will indicate whether a stock is trading higher or lower than the previous day’s closing price.
If a stock is trading higher than the previous end of day trading price, the arrow will point up. If a stock is trading lower than the closing price the day before, the arrow will point down.
5. Change Amount
This builds upon the arrow we just learned to identify and tells us how much the price of a stock has changed since the previous day’s closing price—it indicates dollars and cents.
This is also sometimes followed by a parenthetical number to represent the percentage the price has changed.
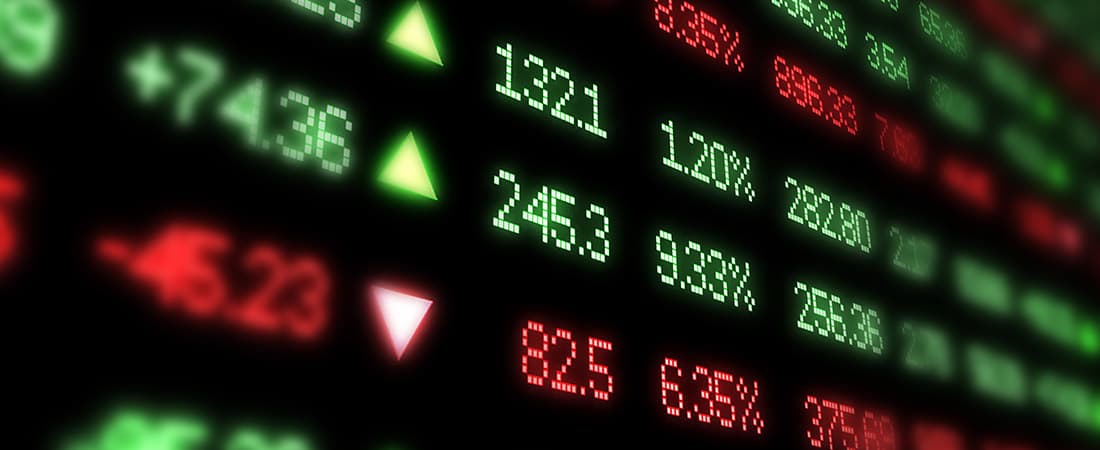
Pay attention to color
Color is a super fast clue about a stock’s performance
Green = Trading higher than the previous day’s close.
Red = Trading lower than the previous day’s close.
Blue/White = Unchanged from the previous day’s close.
Where did “stock ticker” come from?
The ticker part of ‘stock ticker’ comes from the ticker tape machine, which was originally developed in 1867 by Edward A. Calahan, an engineer at the American Telegraph Co., and later improved by the inventor Thomas Edison. It showed the fluctuations in investments on the New York Stock Exchange, one of the largest stock exchanges in the world.
In the early days of stock trading on Wall Street, people would actually run the numbers from the market floor to individual brokerages and back.
The Nasdaq launched as an all-electronic exchange in 1971.
It wasn’t until the 2000s that the NYSE became fully automated, although it still has human traders who play an important role.
Ready to learn more about the market, every week? Sign up for our newsletter.

Written by
Team Stash
We want to turn money into a source of hope and opportunity. We teach people how to build good habits, save more and make it easy and affordable to get started investing. So far, we’ve helped over 6 million people create a more secure financial future with our expert advice and award winning investing app.
Related articles

investing
Jan 13, 2026
FAQ: Personal Portfolio
investing
Jan 05, 2026
Why did the price I bought or sold my investments at change? What are Trading Windows?

investing
Dec 11, 2025
How to Invest through the Holidays—Without the Stress

investing
Oct 23, 2025
Why Millions Are Canceling Disney+ and Hulu and What It Means for Investors
investing
Sep 30, 2025
Securities Lending

investing
Aug 15, 2025
Money Insights
By using this website you agree to our Terms of Use and Privacy Policy. To begin investing on Stash, you must be approved from an account verification perspective and open a brokerage account.